



From data to insight: dashboards and metrics in media monitoring
The digital space keeps growing, and tracking media coverage has become a challenge for companies, marketing departments and PR professionals — mostly because of sheer volume.
Yet accurate monitoring is only half the job. Collected items need to be organised, and then read for the detailed insights and metrics that show how effective a communications campaign and a media presence really are.
Our media monitoring platform, NewtonOne New Generation, provides detailed insight into the metrics and trends that matter, using advanced technology for data analysis and visualisation.
Dashboards: a clear picture of your communication
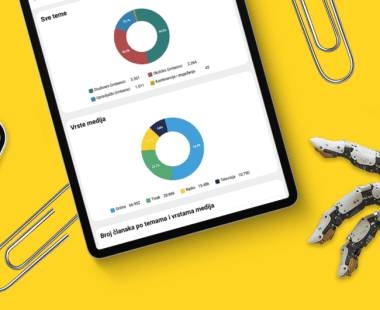
A dashboard is, in short, a visual representation of a large volume of collected data — in our case, the items gathered through media monitoring. It turns the metrics that show the success of your communication efforts into something readable at a glance.
Whether you follow trends across your industry, the reach of items that mention you, or which outlets are most favourable towards you, the dashboard offers an intuitive interface that visualises and analyses complex data sets.
Dashboards inform communication strategy efficiently. They let you establish quickly whether you have met your KPIs, whether a campaign is moving in the intended direction, or whether resources need to be reallocated.
What the numbers tell us: key media monitoring metrics
So which quantitative media monitoring metrics can be read from our dashboards? These are among the most important.
- Reach — daily, weekly or monthly. The number of unique users who visited a given page in a defined period. “Unique” means each user is counted once, however many times they visit. Useful for understanding the size of an audience.
- OTS (Opportunity to See). Measures how many times your message had the opportunity to be seen, based on the reach of the outlet that published it. A key metric for the real reach of campaigns and coverage in print, radio and television.
- AVE (Advertising Value Equivalent). Measures the equivalent advertising value of the media space your coverage occupied — what it would have cost to achieve the same effect through paid advertising. It attracts criticism, but it is simple and easily understood, and it helps in setting PR budgets.
- GRP (Gross Rating Point), or media impact. Represents cumulative viewership, listenership or readership within a target group, regardless of how many times the same person sees, hears or reads the content.
- Top authors and top sources. These help identify the most influential authors and outlets, so you can see which journalists, bloggers or media have the most influence on your brand.
- Topics and target groups. Our platform sorts coverage by topic and identifies the demographic groups the message reached. This helps adapt marketing strategy to the specific interests and needs of the groups you are targeting.
Beyond these, we also track total item and mention counts, overall visibility, a breakdown by media type, the number of articles over time, target groups and their demographics, and much more.
For each of them you have more than 40 chart types to choose from, along with qualitative metrics, so you can build exactly the report you need. More on that on our media analysis page.
Get in touch for a trial monitoring period.

YOU MAY BE INTERESTED IN

THEY TRUST US











Download the Presscut Mobile app and stay tuned every step of the way.


Komentirajte